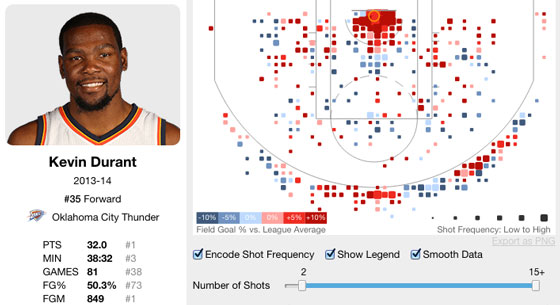

Screen capture of Buckets visualization app. Image: Peter Beshai.
For many sports enthusiasts, tracking the stats of their favourite teams and players is part of getting into the game. For fans of professional basketball, this engagement has been raised to a whole new level thanks to the introduction of camera-tracking technology on the court.
Since introducing its SportVU Player Tracking technology, the National Basketball Association (NBA) has been tracking data on nearly every shot in regular season. It is the first major U.S. sports league, and perhaps the first in the world, to invest heavily in motion tracking.
Unfortunately, NBA fans do not have the tools to easily access analytics on this data, leaving them to sift through long tables of numbers to find patterns or statistics of interest.
Enter Buckets, a new visualization developed by University of British Columbia PhD student Peter Beshai that allows fans and casual analysts to discover and compare facts about any players and teams in the league.
The app's main feature is an interactive "shot chart" of every shot made in the NBA’s 2013-2014 season. First developed by Michigan State University professor Kirk Goldsberry, the shot chart shows a “heat map” of the X-Y location and frequency of shots on a basketball court. Buckets makes the chart interactive: sliders filter data points to reveal different metrics, assisted by legends and descriptions of what is being shown; users can analyze shot performances for individual players, teams, or the entire league.
“There are only a few tools out there that allow you to do shot charts for any individual player you want. They’re also not that easy to use or not clear about what’s being shown,” said Beshai. “What I think [Buckets] brings is a fairly easy-to-use interface to access any player in the league to quickly get an overview of their shooting behaviour in a visual sense.”
Beshai’s idea for the app came out of a class project for an Information Visualization course taught by UBC computer science professor Tamara Munzner.
“I’m a big Toronto Raptors fan. I watch a lot of basketball and I read a lot about basketball. Tamara and I both agreed it would be fun to take real data and do something fun for this class project, so I decided to do an NBA visualization. I thought it could be really cool to share it online.”
Following its public release in December, Buckets garnered some high-profile attention on Twitter, including from Kirk Goldsbury himself. The app was also featured on Flowing Data, a prominent data visualization website. Fans have since blogged about some of the interesting insights into their team’s performance based on Bucket’s analytics.
Beshai, who joined GRAND in 2012 as a master’s student, is currently working on his PhD degree at UBC with GRAND researcher Dr. Karon MacLean. It was at the GRAND 2014 Annual Conference in Ottawa (where Beshai happen to win Best RNote presentation) that he was approached by MacLean to join a new informatics project within GRAND in conjunction with his doctoral studies. Consequently, Beshai’s research focus has shifted from basketball to health, developing applications for people to better understand their health through personal data tracking and self-experimentation.
“I have a lot of ideas for future visualizations that I could do, but I’m not sure I’ll be putting too much time to pursue them. Someone else might be able to take these cool ideas and develop them.”
MEDIA CONTACT
Spencer Rose
GRAND NCE